Here’s a collection of my favorite projects. Take a look!
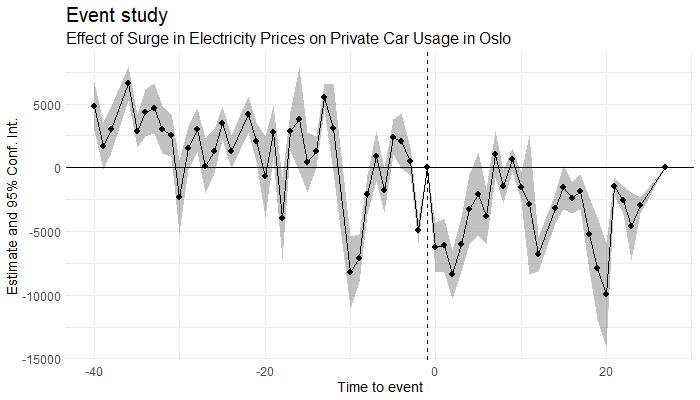
Impact of Electricity Prices on Private Car Usage in Norway
A causal analysis investigating how fluctuations in electricity prices affect private car usage in Norway’s major cities. Using event study methodology and econometric models, the project highlights regional differences and transportation trends.
View on GitHubDay-Ahead Electricity Price Forecast (Live)
View on GitHub
⚡ About the Pipeline & Forecast
This project combines historical electricity prices and weather data to generate rolling day-ahead forecasts. Feature engineering includes calendar effects and lag structures suitable for 24-hour forecasting.
The pipeline is orchestrated in Azure Databricks and runs automatically every 12 hours. Forecasts are appended alongside realized prices, enabling continuous performance evaluation and transparent comparison between predicted and actual outcomes.
The Power BI dashboard visualizes live forecasts, historical prices, and model accuracy over time, reflecting a realistic production analytics workflow rather than a one-off notebook.
Seismic Activity Tracker: Updated Daily
📊 About the Dataset & Dashboard
This end-to-end Microsoft Fabric project uses real-time data from the USGS Earthquake API. Earthquakes from the past 5 days are ingested and processed with notebooks and pipelines in Fabric. The final Power BI report displays seismic activity across the globe using dynamic visuals, significance-based classification, and interactivity.
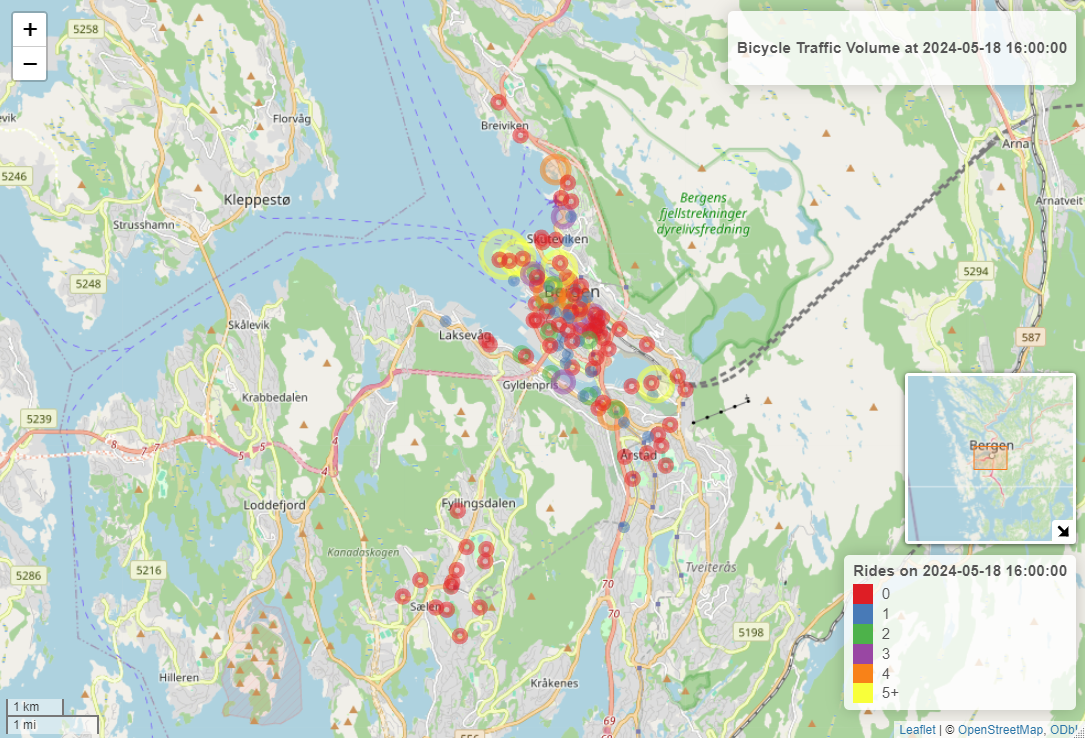
Bergen Bysykkel 2024: Cleaning, Predicting, and Mapping
Part 1 of a two-part project exploring Bergen's bike rental trends. It involves data cleaning, linear regression modeling, and dynamic geospatial mapping using Leaflet.
View on GitHubAdventureWorks Sales Report
📊 About the Dataset & Dashboard
Built using the AdventureWorks dataset, this Power BI dashboard analyzes key sales performance metrics for a fictional manufacturing company. It explores revenue trends, profit margins, total orders, and return rates, providing business insights through interactive filtering and drill-through analysis. The project involves data transformation, modeling, and advanced visualization techniques, including KPI cards, pagination, and tooltips. Designed as a real-world BI scenario, this dashboard demonstrates the power of data-driven decision-making.
Lego Sets Dashboard
📊 About the Dataset & Dashboard
This Power BI dashboard analyzes LEGO sets released from 1970 to 2022, using data sourced from Brickset. It explores trends in LEGO pricing, set sizes, and theme popularity across decades, providing key insights through interactive visualizations and dynamic filters. The dashboard includes KPI cards for total sets, average price, and average piece count, along with slicers for theme groups, age ranges, and individual themes. Advanced features include tooltips displaying set images, decomposition trees for detailed category analysis, and bookmark actions for resetting filters. This project showcases the power of interactive reporting in business intelligence.
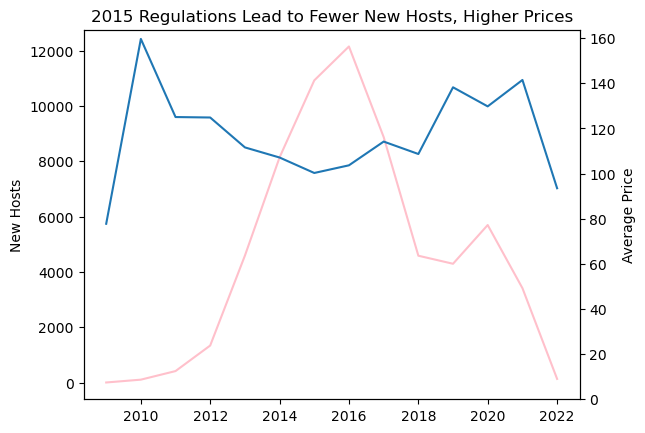
AirBnB Listing Analysis in Paris
This project explores the impact of recent regulations on AirBnB host activity and pricing in Paris. Using Python and data analysis techniques, the study investigates pricing trends, neighborhood differences, and host growth over time.
View on GitHub